
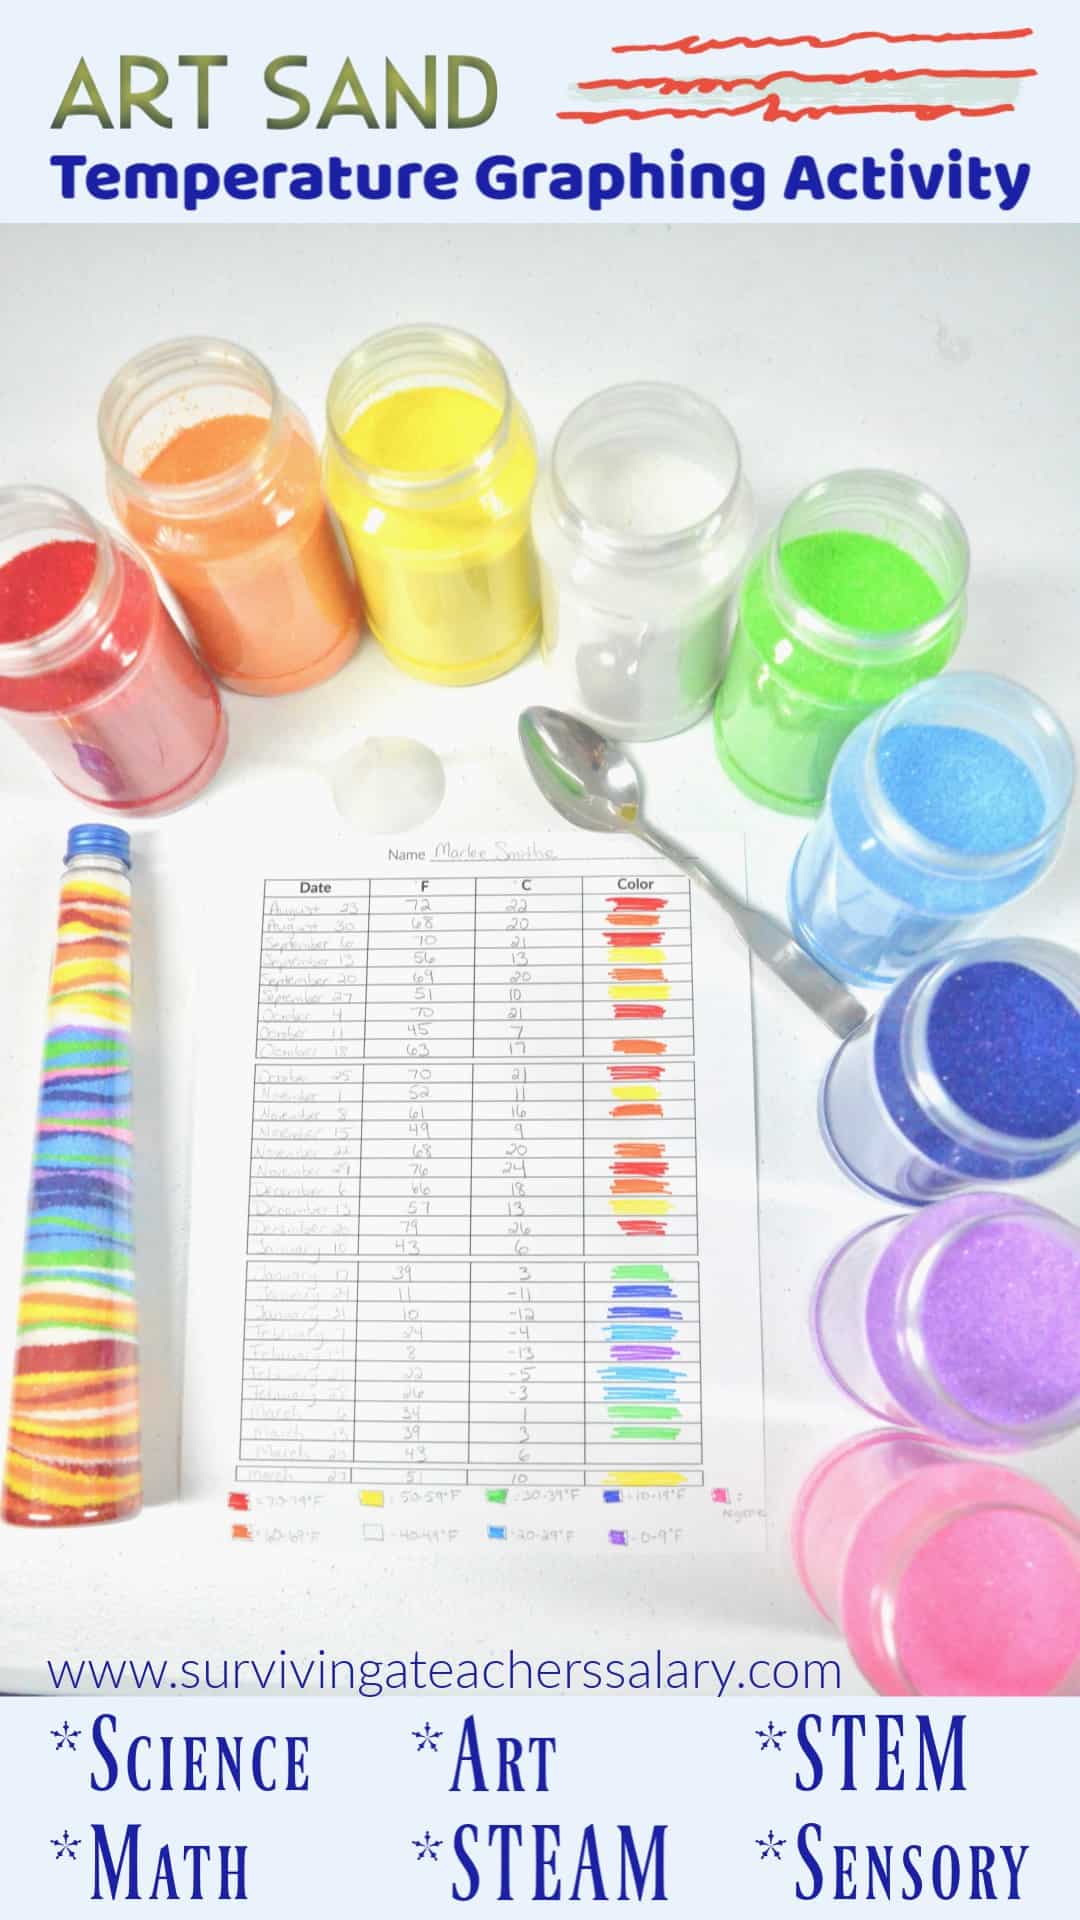
Temperature Weather Graph Chart Printable Art Sand Activity
This post may contain affiliate links, view our disclosure policy for details.
Winter lesson plans usually revolve around penguins, gingerbread men, and snowflakes, but this free winter lesson plan is 100% unique to our site! Below you’ll find our free temperature weather graph chart printable and art sand activity. ALL of our supplies were sent to us by Oriental Trading for this project as part of their marketing campaign!
Have you ever seen temperature blanket crochet projects? The basic idea is that you crochet a row every day color coded on the current average temperatures for that day. At the end of a year you’ll have a stunning blanket of colors that reveal the past year’s weather pattern.
I took the same concept but applied it to the classroom by using art sand! You’ll be incorporating both math and science into this sensory art activity.
Lesson Plan Objectives:
- Record the average temperature of a specific city over a given period of time.
- Create a visual piece of art based on the recorded temperature graph.
Materials Needed:
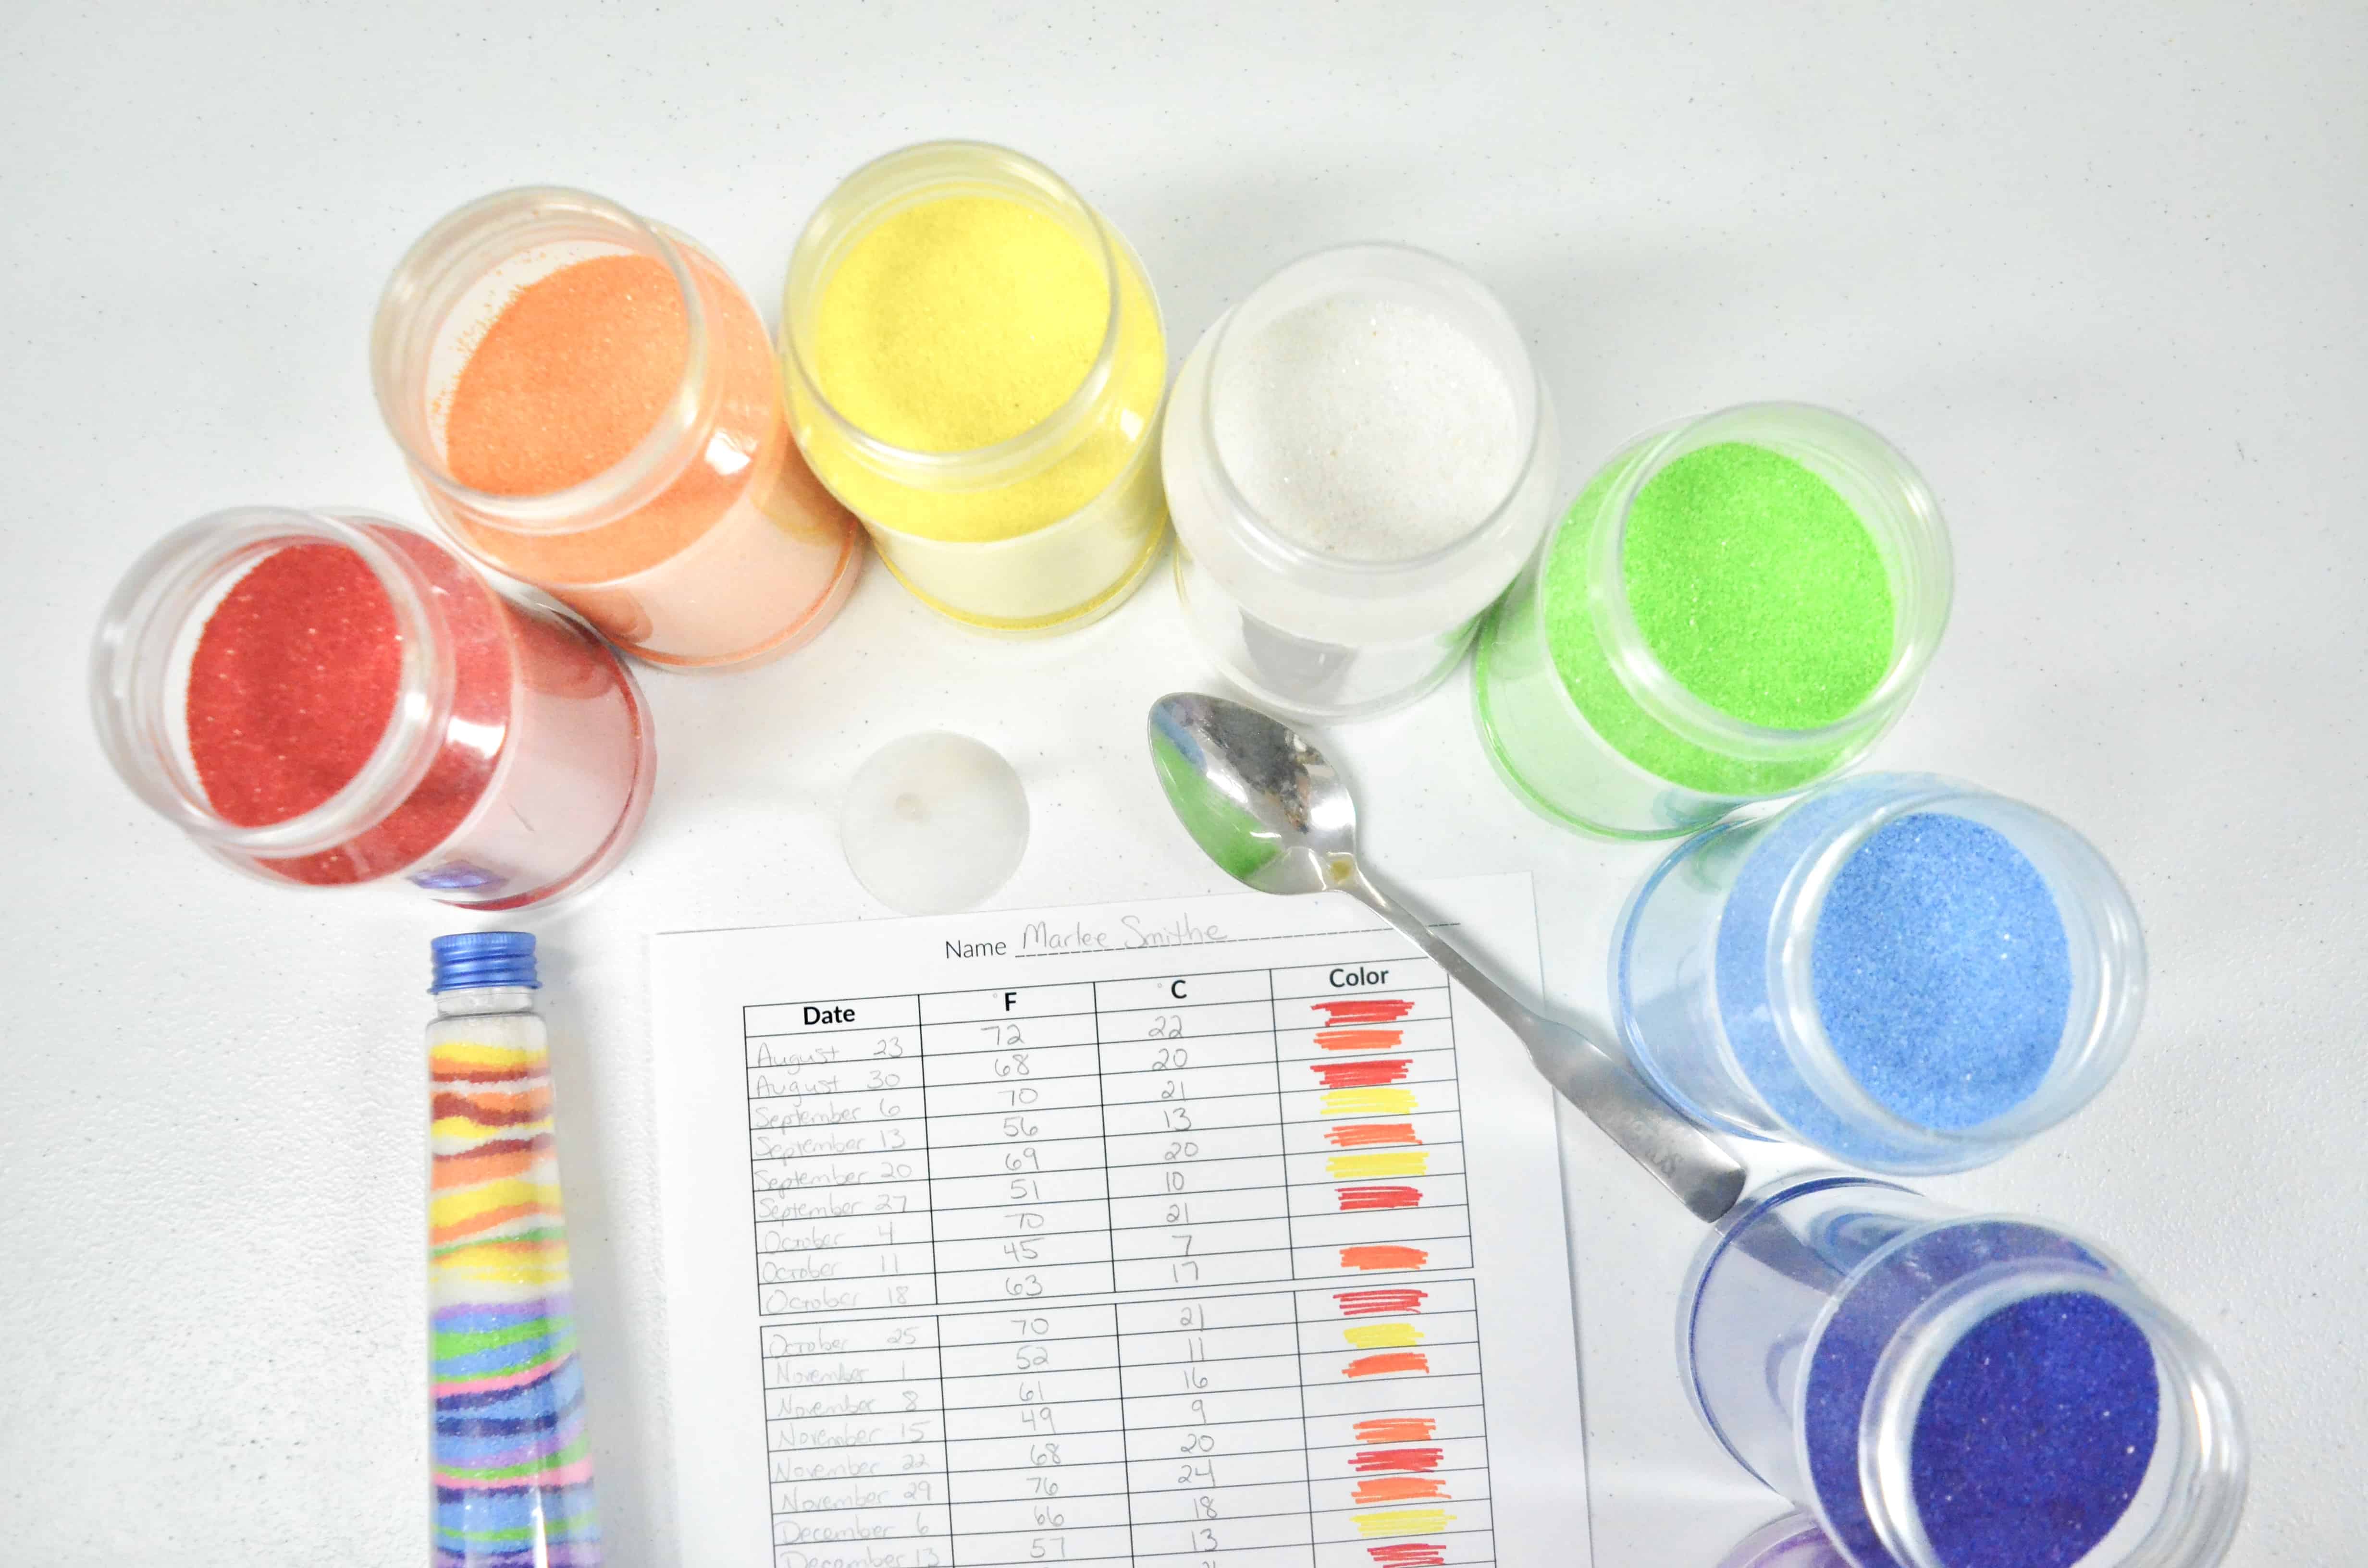
Craft Sand – at least 4-5 colors or more
Small funnel
Bottle or container
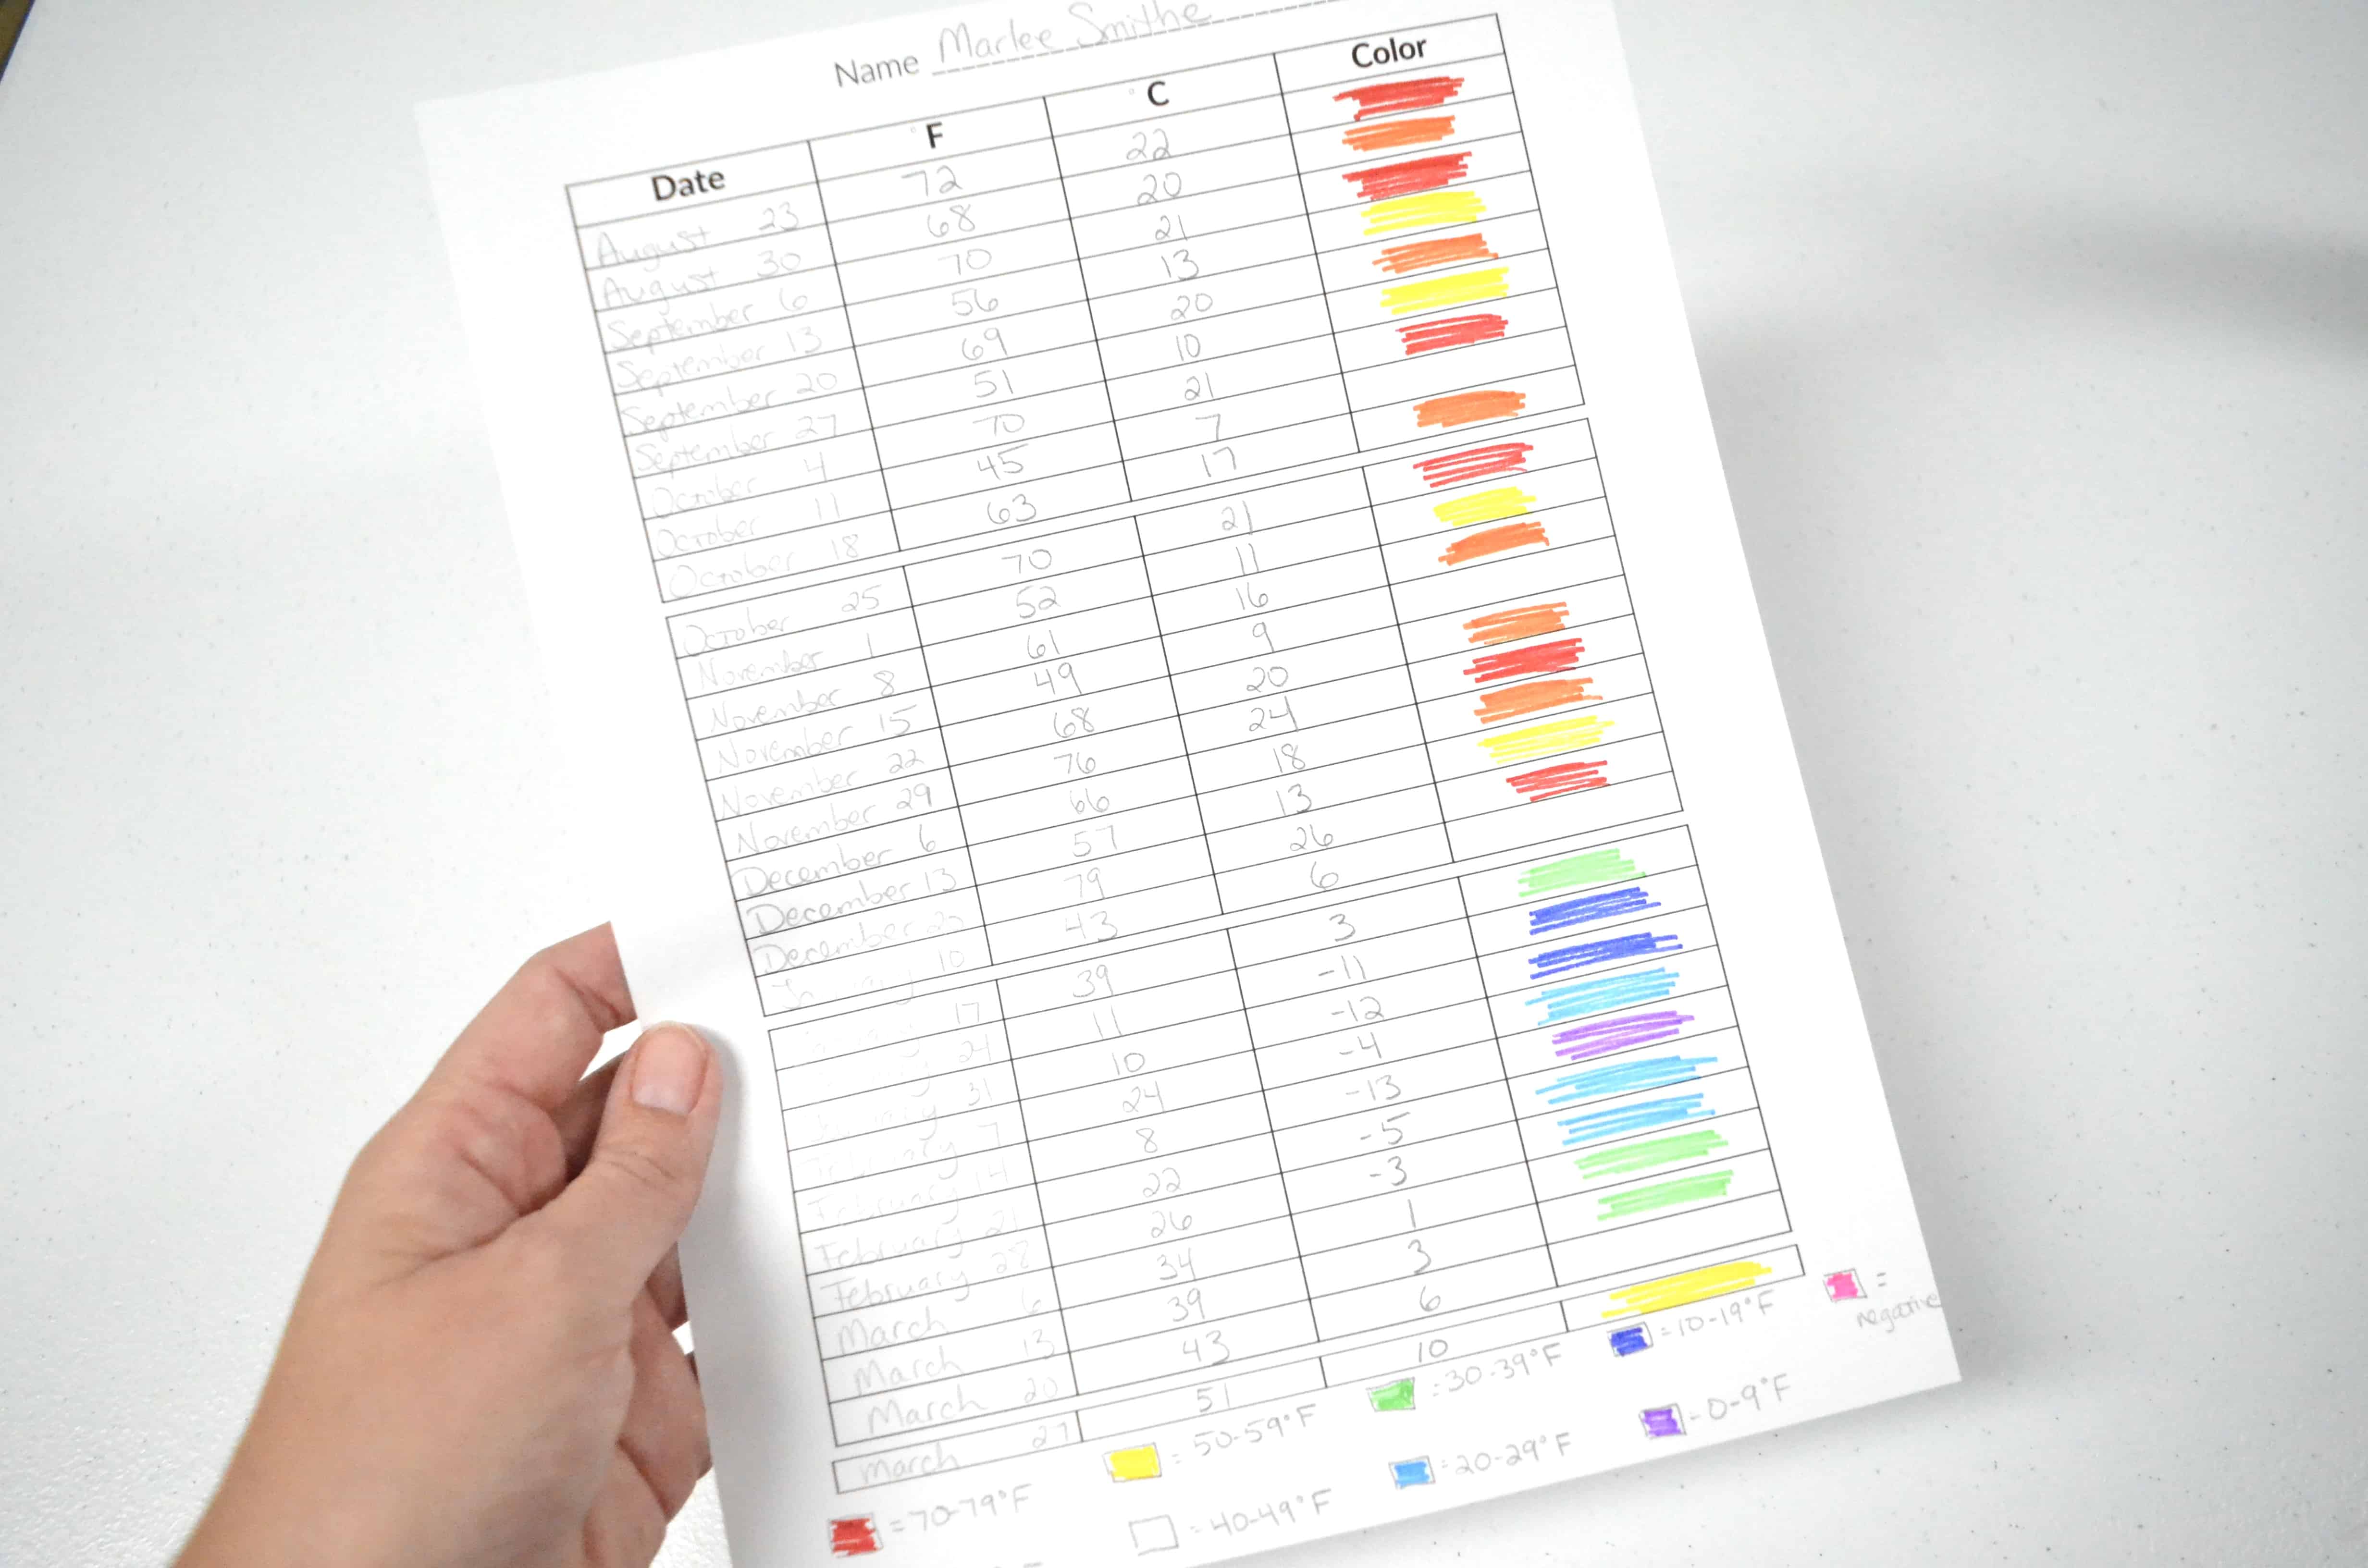
Printable Graph Chart here: Recording Temperature Graph
Lesson Plan Project Ideas:
You can use this temperature graph art sand project in a number of ways and can retrofit the basic concept to any lessons you are planning for your classroom. Below are just a few ideas to get you started.
- Record the average daily temperature for a month and create a temperature sand art project.
- Assign various cities nationally or internationally to each student to record then create their temperature sand art project.
- Record the average temperature per MONTH for a quick 12 layer temperature sand art project.
- Record the temperature every single day of the year and create an intensely layered temperature sand art project.
Lesson Plan Instructions:
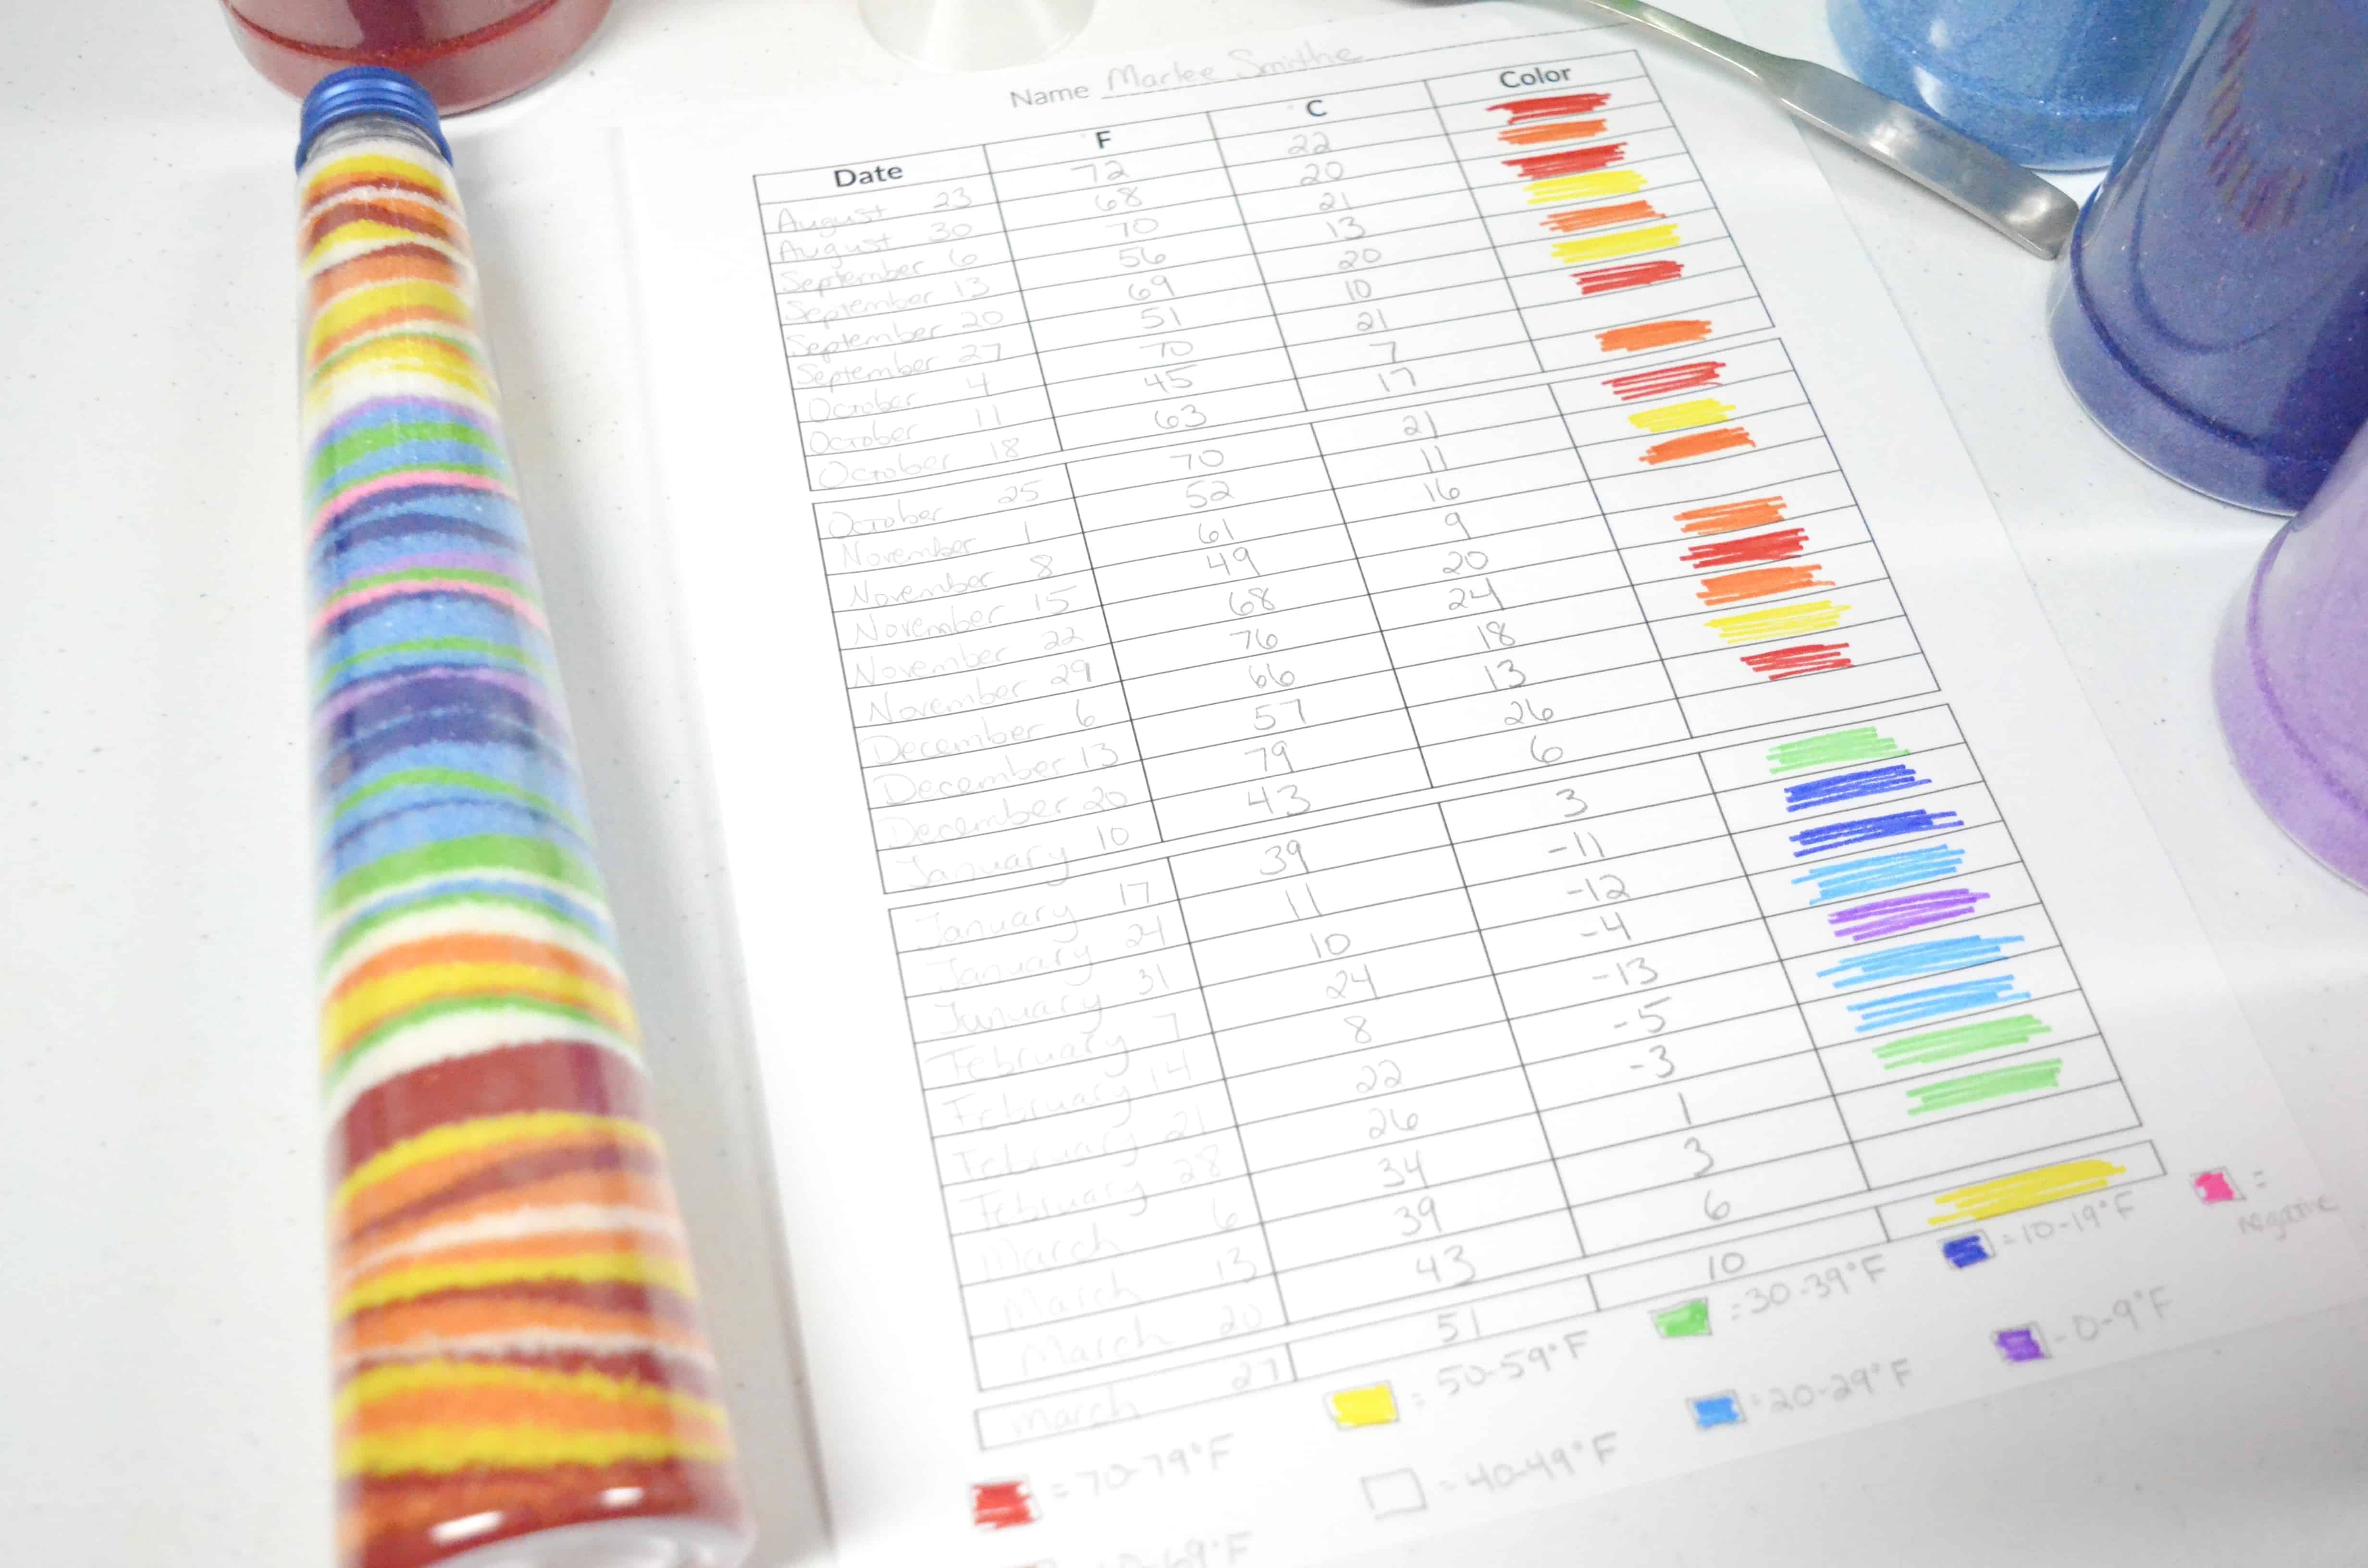
- Record the weather over a specific period of time such as daily for a month, average monthly temperature, etc. based on the ideas above.
- Designate a color of art sand for each temperature/temperature range based on how many art sand colors you have available.
- Pour a specified amount of art sand into your art sand container based on your temperature graph recorded. I was able to do 3 months of recording with about a half a spoonful of sand.
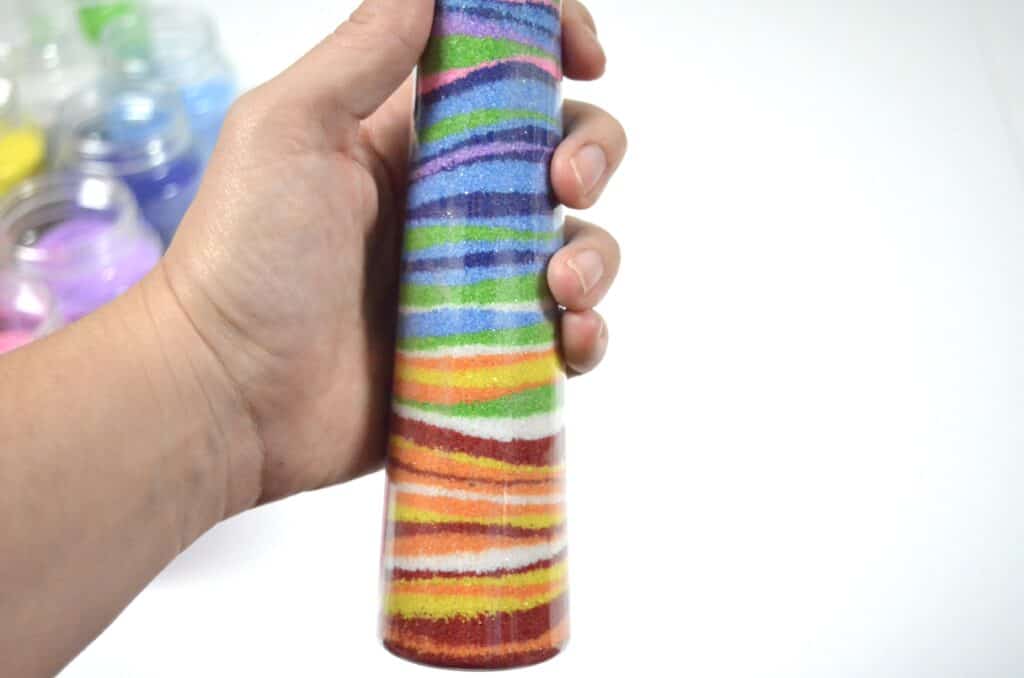
After you are done filling up your bottle of sand you will see a representation of weather patterns and color changes for your particular area!
Further Discussion and Project Measuring:
At the end of the project, have the students display their temperature art, and see if the class can place them in order from the coldest climate to the warmest. Careful – that can get tricky!
You can also have the class guess what regions of the world are represented in various bottles based on the color patterns (projects with mostly reds/yellows/oranges may be south of the equator while blues and purples may tend to be further up north).
Get tricky! Have two bottles from similar regions side by side by featuring a city with high altitude and a city at sea level. Discuss that regions have also have extremely different weather patterns!
Math Topics Covered:
- graphing
- temperature – F*, C*
- temperature patterns
Science Topics Covered:
- meteorology
- climates
- weather, general
- weather patterns
Geography Topics Covered:
- elevation / altitude
- geographic earth poles
- northern vs southern hemisphere
- mountain ranges
Teacher Recap Ideas-
*Google “temperature blanket crochet” to get a great visual of how beautiful your sand art projects might turn out!
*Temperature Art Sand ideas:
- Monitor the weather daily locally and “record” on the printable graph and with colored art sand.
- Research the average temperature for the month and fill your bottle with 12 sand layers – one color for each month’s average temperature.
- Assign different major cities (globally or nationally) to each student to monitor and design a temperature project for their art sand bottle. View the varying temperature patterns around the world!
*Extend lessons into geographical locations and culture.